Stay Ahead of the Curtain Call!
Get the latest Broadway Grosses instantly, direct to your email every week.
Jump to Week: 1 | 2 | 3 | 4 | 5 | 6 | 7 | 8 | 9 | 10 | 11 | 12 | 13 | 14 | 15 | 16 | 17 | 18 | 19 | 20 | 21 | 22 | 23 | 24 | 25 | 26 | 27 | 28 | 29 | 30 | 31 | 32 | 33 | 34 | 35 | 36 | 37 | 38 | 39 | 40 | 41 | 42 | 43 | 44 | 45 | 46 | 47 | 48 | 49 | 50 | 51 | 52
| YEAR | Total Gross | Avg. Gross | Average Ticket | Top Ticket | Seats Sold |
Total Seats |
Shows | Perf. | Average % |
| 1996 | $6,365,489 | $424,366 | $42.96 | $75.00 | 140,316 | 44,822 | 15 | 117 | 29.29% |
| 1997 | $7,765,439 | $388,272 | $44.87 | $75.00 | 162,311 | 190,957 | 20 | 155 | 83.82% |
| 1998 | $11,349,164 | $391,350 | $47.43 | $80.00 | 233,728 | 283,829 | 29 | 222 | 81.15% |
| 1999 | $11,045,141 | $409,079 | $49.01 | $80.00 | 219,565 | 273,324 | 27 | 209 | 79.41% |
| 2000 | $9,612,696 | $400,529 | $52.18 | $90.00 | 178,220 | 239,444 | 24 | 190 | 74.33% |
| 2001 | $11,294,856 | $451,794 | $55.33 | $90.00 | 196,729 | 234,508 | 25 | 190 | 83.18% |
| 2002 | $11,062,687 | $480,986 | $59.54 | $480.00 | 173,832 | 195,616 | 23 | 155 | 89.27% |
| 2003 | $14,793,846 | $493,128 | $60.55 | $480.00 | 229,858 | 293,754 | 30 | 235 | 76.79% |
| 2004 | $14,755,643 | $546,505 | $64.47 | $480.00 | 216,516 | 273,809 | 27 | 210 | 78.19% |
| 2005 | $11,667,603 | $555,600 | $64.63 | $240.00 | 174,926 | 216,391 | 21 | 166 | 79.82% |
| 2006 | $13,896,214 | $534,470 | $70.08 | $301.25 | 190,127 | 250,598 | 26 | 204 | 75.51% |
| 2007 | $17,425,325 | $580,844 | $72.07 | $301.25 | 226,917 | 287,802 | 30 | 232 | 77.54% |
| 2008 | $18,802,116 | $569,761 | $70.47 | $351.50 | 253,631 | 315,588 | 33 | 261 | 78.20% |
| 2009 | $14,354,031 | $624,088 | $75.66 | $350.00 | 179,852 | 220,277 | 23 | 183 | 80.07% |
| 2010 | $15,774,093 | $685,830 | $85.61 | $350.00 | 178,293 | 221,692 | 23 | 179 | 80.95% |
| 2011 | $15,106,300 | $686,650 | $81.25 | $350.00 | 178,821 | 217,839 | 22 | 171 | 81.44% |
| 2012 | $15,641,929 | $651,747 | $83.56 | $477.00 | 177,602 | 236,072 | 24 | 192 | 75.26% |
| 2013 | $19,053,140 | $907,292 | $99.48 | $700.00 | 185,503 | 212,895 | 21 | 164 | 86.80% |
| 2014 | $21,192,765 | $784,917 | $98.76 | $477.00 | 203,834 | 244,980 | 27 | 211 | 82.78% |
| 2015 | $22,494,434 | $803,373 | $108.80 | $475.00 | 203,695 | 252,818 | 28 | 212 | 82.44% |
| 2016 | $25,713,391 | $829,464 | $96.03 | $477.00 | 254,659 | 306,386 | 31 | 247 | 83.37% |
| 2017 | $19,809,376 | $861,277 | $108.19 | $849.00 | 177,044 | 221,731 | 23 | 172 | 81.54% |
| 2018 | $26,335,058 | $1,053,402 | $120.33 | $849.00 | 213,716 | 234,360 | 25 | 193 | 90.92% |
| 2019 | $30,511,551 | $1,052,122 | $116.97 | $849.00 | 252,489 | 279,336 | 29 | 226 | 90.94% |
| 2020 | $31,152,553 | $1,153,798 | $123.41 | $847.00 | 250,646 | 265,296 | 27 | 211 | 94.35% |
| 2022 | $18,939,842 | $996,834 | $110.02 | $697.00 | 165,971 | 191,135 | 19 | 148 | 86.93% |
| 2023 | $23,064,393 | $1,098,304 | $115.46 | $549.00 | 192,323 | 202,075 | 21 | 167 | 94.77% |
| 2024 | $26,946,864 | $1,171,603 | $134.32 | $649.00 | 201,227 | 213,831 | 23 | 178 | 93.75% |
Note: All data presented for informational purposes only. BroadwayWorld.com makes no guarantees as to the accuracy of the data, or the matter in which it's presented. Source: The Broadway League..
Videos
 |
KING OF DIAMONDS starring Rob Garrett & the Pretty Amazing Band
OYO Hotel/Casino (9/8 - 12/31)
PHOTOS
| |

|
The Cher Show (Non-Equity)
Smith Center For Performing Arts (9/17 - 9/22) | |

|
Two Girls
Open-Door Playhouse (11/12 - 12/12) | |

|
A Hill of Beans
Open-Door Playhouse (11/26 - 12/26) | |

|
The Fish and the Worm
Open-Door Playhouse (11/28 - 12/28) | |

|
Wolf Play
Black Box Theatre at UNLV (3/28 - 4/6) | |
|
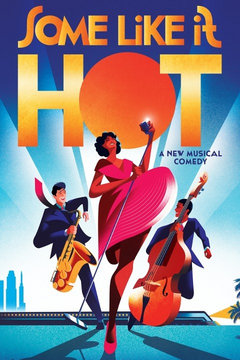
Some Like It Hot
Pioneer Center for the Performing Arts (2/4 - 2/9) | |

|
Beethoven And Misfortune Cookies
Open-Door Playhouse (3/11 - 3/11) | |
| VIEW SHOWS ADD A SHOW | ||
Recommended For You


