Stay Ahead of the Curtain Call!
Get the latest Broadway Grosses instantly, direct to your email every week.
Jump to Week: 1 | 2 | 3 | 4 | 5 | 6 | 7 | 8 | 9 | 10 | 11 | 12 | 13 | 14 | 15 | 16 | 17 | 18 | 19 | 20 | 21 | 22 | 23 | 24 | 25 | 26 | 27 | 28 | 29 | 30 | 31 | 32 | 33 | 34 | 35 | 36 | 37 | 38 | 39 | 40 | 41 | 42 | 43 | 44 | 45 | 46 | 47 | 48 | 49 | 50 | 51 | 52
| YEAR | Total Gross | Avg. Gross | Average Ticket | Top Ticket | Seats Sold |
Total Seats |
Shows | Perf. | Average % |
| 1996 | $6,742,154 | $421,385 | $41.93 | $75.00 | 152,395 | 46,016 | 16 | 123 | 27.36% |
| 1997 | $7,816,894 | $390,845 | $42.88 | $75.00 | 171,728 | 193,841 | 20 | 157 | 87.10% |
| 1998 | $11,801,864 | $393,395 | $44.78 | $75.00 | 252,976 | 294,377 | 30 | 235 | 84.40% |
| 1999 | $11,764,288 | $405,665 | $46.23 | $80.00 | 244,831 | 280,539 | 29 | 222 | 84.86% |
| 2000 | $10,391,962 | $432,998 | $52.62 | $90.00 | 190,611 | 234,336 | 24 | 186 | 81.03% |
| 2001 | $11,686,593 | $467,464 | $52.52 | $90.00 | 214,372 | 242,584 | 25 | 199 | 87.53% |
| 2002 | $12,093,653 | $465,140 | $58.95 | $480.00 | 199,254 | 217,759 | 26 | 177 | 88.73% |
| 2003 | $13,815,895 | $476,410 | $58.05 | $480.00 | 219,936 | 283,477 | 29 | 224 | 75.78% |
| 2004 | $15,060,671 | $579,257 | $60.99 | $480.00 | 233,364 | 267,859 | 26 | 205 | 84.88% |
| 2005 | $13,891,004 | $603,957 | $67.19 | $240.00 | 199,871 | 227,292 | 23 | 173 | 87.58% |
| 2006 | $16,497,524 | $634,520 | $73.06 | $301.25 | 219,004 | 253,823 | 26 | 207 | 86.21% |
| 2007 | $18,294,392 | $630,841 | $69.55 | $301.25 | 249,955 | 286,360 | 29 | 232 | 85.76% |
| 2008 | $17,910,138 | $542,731 | $66.84 | $351.50 | 251,789 | 318,171 | 33 | 263 | 77.11% |
| 2009 | $15,054,535 | $654,545 | $73.05 | $350.00 | 193,351 | 221,336 | 23 | 184 | 84.75% |
| 2010 | $17,755,740 | $682,913 | $76.53 | $350.00 | 216,218 | 241,739 | 26 | 203 | 88.20% |
| 2011 | $16,930,141 | $769,552 | $86.34 | $350.00 | 187,005 | 221,052 | 22 | 174 | 84.01% |
| 2012 | $20,071,198 | $771,969 | $90.92 | $477.00 | 209,941 | 248,474 | 26 | 204 | 84.34% |
| 2013 | $18,315,911 | $796,344 | $90.85 | $700.00 | 191,325 | 223,402 | 23 | 173 | 85.13% |
| 2014 | $20,540,286 | $760,751 | $92.43 | $477.00 | 208,637 | 241,561 | 27 | 206 | 84.88% |
| 2015 | $23,193,753 | $828,348 | $104.57 | $475.00 | 216,711 | 260,618 | 28 | 219 | 83.73% |
| 2016 | $23,951,917 | $798,397 | $91.43 | $477.00 | 246,349 | 292,968 | 30 | 236 | 83.91% |
| 2017 | $25,574,529 | $983,636 | $111.64 | $849.00 | 219,844 | 242,899 | 26 | 195 | 91.11% |
| 2018 | $27,049,675 | $1,001,840 | $113.22 | $849.00 | 231,937 | 253,242 | 27 | 205 | 91.92% |
| 2019 | $29,863,192 | $1,029,765 | $113.03 | $849.00 | 253,875 | 282,200 | 29 | 229 | 89.92% |
| 2020 | $29,195,910 | $1,122,920 | $114.42 | $747.00 | 250,954 | 262,130 | 26 | 207 | 95.34% |
| 2022 | $21,835,115 | $1,149,217 | $121.28 | $697.00 | 173,184 | 192,855 | 19 | 149 | 90.16% |
| 2023 | $26,853,298 | $1,220,604 | $132.91 | $629.00 | 194,575 | 206,554 | 22 | 169 | 94.08% |
| 2024 | $26,049,492 | $1,085,396 | $126.70 | $649.00 | 205,020 | 219,225 | 24 | 184 | 93.33% |
Note: All data presented for informational purposes only. BroadwayWorld.com makes no guarantees as to the accuracy of the data, or the matter in which it's presented. Source: The Broadway League..
Videos
 |
KING OF DIAMONDS starring Rob Garrett & the Pretty Amazing Band
OYO Hotel/Casino (9/8 - 12/31)
PHOTOS
| |

|
The Cher Show (Non-Equity)
Smith Center For Performing Arts (9/17 - 9/22) | |

|
Two Girls
Open-Door Playhouse (11/12 - 12/12) | |

|
A Hill of Beans
Open-Door Playhouse (11/26 - 12/26) | |

|
The Fish and the Worm
Open-Door Playhouse (11/28 - 12/28) | |

|
Wolf Play
Black Box Theatre at UNLV (3/28 - 4/6) | |
|
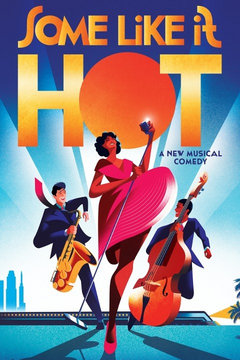
Some Like It Hot
Pioneer Center for the Performing Arts (2/4 - 2/9) | |

|
Beethoven And Misfortune Cookies
Open-Door Playhouse (3/11 - 3/11) | |
| VIEW SHOWS ADD A SHOW | ||
Recommended For You


