Stay Ahead of the Curtain Call!
Get the latest Broadway Grosses instantly, direct to your email every week.
Jump to Week: 1 | 2 | 3 | 4 | 5 | 6 | 7 | 8 | 9 | 10 | 11 | 12 | 13 | 14 | 15 | 16 | 17 | 18 | 19 | 20 | 21 | 22 | 23 | 24 | 25 | 26 | 27 | 28 | 29 | 30 | 31 | 32 | 33 | 34 | 35 | 36 | 37 | 38 | 39 | 40 | 41 | 42 | 43 | 44 | 45 | 46 | 47 | 48 | 49 | 50 | 51 | 52
| YEAR | Total Gross | Avg. Gross | Average Ticket | Top Ticket | Seats Sold |
Total Seats |
Shows | Perf. | Average % |
| 1996 | $5,825,259 | $364,079 | $41.11 | $75.00 | 136,687 | 44,822 | 16 | 124 | 25.83% |
| 1997 | $6,899,127 | $328,530 | $42.85 | $75.00 | 153,120 | 193,212 | 21 | 157 | 79.96% |
| 1998 | $10,449,493 | $360,327 | $44.64 | $75.00 | 224,220 | 285,179 | 29 | 225 | 76.58% |
| 1999 | $10,268,617 | $354,090 | $46.02 | $85.00 | 216,189 | 281,150 | 29 | 227 | 75.67% |
| 2000 | $10,917,847 | $454,910 | $51.28 | $90.00 | 206,607 | 235,392 | 24 | 185 | 87.20% |
| 2001 | $9,980,833 | $383,878 | $50.81 | $90.00 | 187,323 | 246,088 | 26 | 203 | 75.89% |
| 2002 | $11,771,048 | $452,733 | $57.01 | $480.00 | 195,243 | 241,552 | 26 | 195 | 79.86% |
| 2003 | $11,437,907 | $423,626 | $57.95 | $480.00 | 181,199 | 261,648 | 27 | 205 | 67.48% |
| 2004 | $12,751,496 | $510,060 | $60.48 | $480.00 | 198,231 | 257,123 | 25 | 194 | 75.74% |
| 2005 | $14,798,418 | $616,601 | $64.96 | $240.00 | 221,132 | 244,899 | 24 | 186 | 89.11% |
| 2006 | $15,701,015 | $654,209 | $71.56 | $301.25 | 212,064 | 233,448 | 24 | 192 | 89.73% |
| 2007 | $15,380,054 | $512,668 | $68.07 | $351.50 | 214,013 | 296,314 | 30 | 239 | 71.47% |
| 2008 | $14,835,793 | $463,619 | $66.35 | $351.50 | 213,345 | 298,888 | 32 | 249 | 70.65% |
| 2009 | $13,630,245 | $545,210 | $71.38 | $350.00 | 182,007 | 228,993 | 25 | 183 | 78.14% |
| 2010 | $14,246,757 | $527,658 | $72.01 | $350.00 | 186,584 | 252,725 | 27 | 214 | 73.97% |
| 2011 | $17,734,578 | $709,383 | $84.62 | $350.00 | 202,226 | 225,243 | 25 | 179 | 88.64% |
| 2012 | $20,315,215 | $781,354 | $89.01 | $477.00 | 217,156 | 250,271 | 26 | 206 | 86.28% |
| 2013 | $17,192,696 | $716,362 | $88.86 | $700.00 | 192,215 | 226,820 | 24 | 174 | 85.53% |
| 2014 | $18,500,516 | $660,733 | $88.08 | $477.00 | 203,099 | 253,804 | 28 | 213 | 80.06% |
| 2015 | $18,617,254 | $716,048 | $95.59 | $475.00 | 189,652 | 249,278 | 26 | 207 | 77.37% |
| 2016 | $20,011,016 | $645,517 | $86.29 | $477.00 | 218,809 | 297,838 | 31 | 243 | 74.64% |
| 2017 | $25,416,826 | $977,570 | $107.53 | $849.00 | 225,366 | 251,219 | 26 | 205 | 90.20% |
| 2018 | $26,316,398 | $877,213 | $118.94 | $850.00 | 224,980 | 269,684 | 30 | 221 | 84.49% |
| 2019 | $27,159,271 | $876,106 | $105.23 | $849.00 | 245,665 | 291,645 | 31 | 237 | 84.34% |
| 2020 | $26,109,896 | $932,496 | $104.75 | $847.00 | 244,515 | 270,403 | 28 | 216 | 90.66% |
| 2022 | $23,004,262 | $1,210,751 | $130.20 | $697.00 | 177,701 | 192,987 | 19 | 145 | 92.17% |
| 2023 | $25,832,430 | $1,123,149 | $126.37 | $549.00 | 201,951 | 215,916 | 23 | 172 | 93.18% |
| 2024 | $23,436,461 | $937,458 | $119.16 | $649.00 | 198,730 | 228,294 | 25 | 194 | 87.86% |
Note: All data presented for informational purposes only. BroadwayWorld.com makes no guarantees as to the accuracy of the data, or the matter in which it's presented. Source: The Broadway League..
Videos
 |
KING OF DIAMONDS starring Rob Garrett & the Pretty Amazing Band
OYO Hotel/Casino (9/8 - 12/31)
PHOTOS
| |

|
The Cher Show (Non-Equity)
Smith Center For Performing Arts (9/17 - 9/22) | |

|
Two Girls
Open-Door Playhouse (11/12 - 12/12) | |

|
A Hill of Beans
Open-Door Playhouse (11/26 - 12/26) | |

|
The Fish and the Worm
Open-Door Playhouse (11/28 - 12/28) | |

|
Wolf Play
Black Box Theatre at UNLV (3/28 - 4/6) | |
|
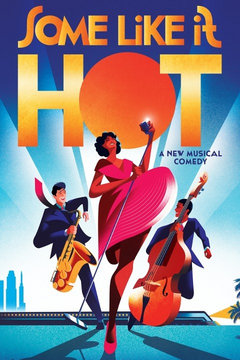
Some Like It Hot
Pioneer Center for the Performing Arts (2/4 - 2/9) | |

|
Beethoven And Misfortune Cookies
Open-Door Playhouse (3/11 - 3/11) | |
| VIEW SHOWS ADD A SHOW | ||
Recommended For You


