Stay Ahead of the Curtain Call!
Get the latest Broadway Grosses instantly, direct to your email every week.
Jump to Week: 1 | 2 | 3 | 4 | 5 | 6 | 7 | 8 | 9 | 10 | 11 | 12 | 13 | 14 | 15 | 16 | 17 | 18 | 19 | 20 | 21 | 22 | 23 | 24 | 25 | 26 | 27 | 28 | 29 | 30 | 31 | 32 | 33 | 34 | 35 | 36 | 37 | 38 | 39 | 40 | 41 | 42 | 43 | 44 | 45 | 46 | 47 | 48 | 49 | 50 | 51 | 52
| YEAR | Total Gross | Avg. Gross | Average Ticket | Top Ticket | Seats Sold |
Total Seats |
Shows | Perf. | Average % |
| 1996 | $8,756,777 | $398,035 | $45.80 | $75.00 | 183,755 | 215,387 | 22 | 170 | 84.45% |
| 1997 | $9,076,788 | $432,228 | $49.16 | $75.00 | 180,291 | 201,550 | 21 | 163 | 89.45% |
| 1998 | $9,435,460 | $410,237 | $49.27 | $75.00 | 184,746 | 236,762 | 23 | 182 | 78.56% |
| 1999 | $9,318,176 | $443,723 | $49.45 | $90.00 | 181,396 | 227,504 | 21 | 168 | 78.67% |
| 2000 | $11,940,163 | $519,138 | $55.19 | $90.00 | 214,249 | 255,768 | 23 | 184 | 84.30% |
| 2001 | $11,049,822 | $460,409 | $54.33 | $100.00 | 192,327 | 242,056 | 24 | 192 | 78.19% |
| 2002 | $13,632,191 | $504,896 | $58.21 | $480.00 | 221,682 | 267,066 | 27 | 215 | 81.77% |
| 2003 | $13,020,576 | $591,844 | $64.96 | $480.00 | 193,138 | 222,699 | 22 | 172 | 86.63% |
| 2004 | $12,179,115 | $487,165 | $61.22 | $251.25 | 183,641 | 258,208 | 25 | 193 | 69.21% |
| 2005 | $13,994,413 | $583,101 | $67.78 | $301.25 | 199,770 | 251,742 | 24 | 191 | 79.28% |
| 2006 | $15,411,367 | $670,059 | $73.90 | $301.25 | 199,256 | 237,286 | 23 | 183 | 82.71% |
| 2007 | $16,323,215 | $777,296 | $79.24 | $351.50 | 201,235 | 220,656 | 21 | 168 | 91.23% |
| 2008 | $17,160,611 | $715,025 | $79.10 | $350.00 | 209,039 | 237,112 | 24 | 186 | 87.50% |
| 2009 | $16,940,468 | $847,023 | $88.83 | $350.00 | 184,326 | 213,432 | 20 | 160 | 86.35% |
| 2010 | $16,139,305 | $768,538 | $84.97 | $350.00 | 183,587 | 233,784 | 21 | 168 | 78.53% |
| 2011 | $11,622,882 | $505,343 | $85.45 | $477.00 | 130,853 | 165,733 | 23 | 118 | 80.11% |
| 2012 | $19,302,941 | $839,258 | $94.96 | $477.00 | 196,997 | 241,136 | 23 | 184 | 82.37% |
| 2013 | $20,496,643 | $891,158 | $96.80 | $477.00 | 199,212 | 240,170 | 23 | 182 | 83.71% |
| 2014 | $22,905,607 | $916,224 | $105.10 | $477.00 | 215,232 | 239,592 | 25 | 195 | 90.35% |
| 2015 | $21,736,748 | $905,698 | $101.54 | $477.00 | 206,895 | 249,937 | 24 | 191 | 82.43% |
| 2016 | $21,495,767 | $859,831 | $98.25 | $477.00 | 209,834 | 261,593 | 25 | 196 | 80.68% |
| 2017 | $26,578,507 | $916,500 | $104.90 | $849.00 | 232,301 | 278,832 | 29 | 232 | 82.78% |
| 2018 | $32,089,528 | $1,069,651 | $126.93 | $850.00 | 250,180 | 284,704 | 30 | 231 | 87.90% |
| 2019 | $28,652,877 | $1,245,777 | $124.69 | $849.00 | 227,568 | 237,992 | 23 | 184 | 96.06% |
| 2022 | $23,513,592 | $1,119,695 | $121.02 | $597.00 | 186,077 | 217,388 | 21 | 167 | 85.47% |
| 2023 | $27,215,118 | $1,088,605 | $121.16 | $549.00 | 214,332 | 249,386 | 25 | 203 | 85.96% |
| 2024 | $28,131,405 | $1,125,256 | $123.61 | $594.00 | 223,670 | 236,800 | 25 | 196 | 94.75% |
Note: All data presented for informational purposes only. BroadwayWorld.com makes no guarantees as to the accuracy of the data, or the matter in which it's presented. Source: The Broadway League..
Videos
 |
KING OF DIAMONDS starring Rob Garrett & the Pretty Amazing Band
OYO Hotel/Casino (9/8 - 12/31)
PHOTOS
| |

|
The Cher Show (Non-Equity)
Smith Center For Performing Arts (9/17 - 9/22) | |

|
Two Girls
Open-Door Playhouse (11/12 - 12/12) | |

|
A Hill of Beans
Open-Door Playhouse (11/26 - 12/26) | |

|
The Fish and the Worm
Open-Door Playhouse (11/28 - 12/28) | |

|
Wolf Play
Black Box Theatre at UNLV (3/28 - 4/6) | |

|
Some Like It Hot
Pioneer Center for the Performing Arts (2/4 - 2/9) | |

|
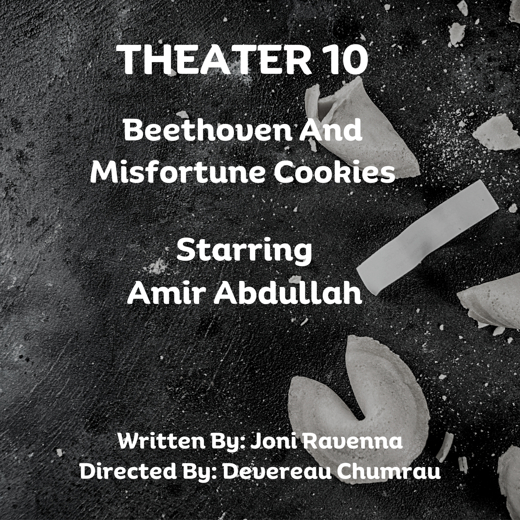
Beethoven And Misfortune Cookies
Open-Door Playhouse (3/11 - 3/11) | |
| VIEW SHOWS ADD A SHOW | ||
Recommended For You


