Stay Ahead of the Curtain Call!
Get the latest Broadway Grosses instantly, direct to your email every week.
Jump to Week: 1 | 2 | 3 | 4 | 5 | 6 | 7 | 8 | 9 | 10 | 11 | 12 | 13 | 14 | 15 | 16 | 17 | 18 | 19 | 20 | 21 | 22 | 23 | 24 | 25 | 26 | 27 | 28 | 29 | 30 | 31 | 32 | 33 | 34 | 35 | 36 | 37 | 38 | 39 | 40 | 41 | 42 | 43 | 44 | 45 | 46 | 47 | 48 | 49 | 50 | 51 | 52
| YEAR | Total Gross | Avg. Gross | Average Ticket | Top Ticket | Seats Sold |
Total Seats |
Shows | Perf. | Average % |
| 1996 | $8,964,796 | $407,491 | $45.46 | $75.00 | 187,274 | 215,669 | 22 | 170 | 86.81% |
| 1997 | $9,133,446 | $434,926 | $48.69 | $75.00 | 182,426 | 204,572 | 21 | 166 | 88.73% |
| 1998 | $11,094,362 | $482,364 | $50.08 | $75.00 | 213,342 | 245,814 | 23 | 185 | 86.13% |
| 1999 | $9,996,267 | $434,620 | $47.79 | $90.00 | 197,416 | 238,730 | 23 | 179 | 80.27% |
| 2000 | $12,356,010 | $514,834 | $54.78 | $90.00 | 222,418 | 264,280 | 24 | 192 | 84.80% |
| 2001 | $12,294,339 | $491,774 | $54.90 | $100.00 | 213,304 | 261,520 | 25 | 200 | 80.39% |
| 2002 | $14,372,962 | $495,619 | $57.05 | $480.00 | 236,712 | 276,661 | 29 | 224 | 83.54% |
| 2003 | $13,677,373 | $621,699 | $63.58 | $480.00 | 206,240 | 221,185 | 22 | 175 | 91.65% |
| 2004 | $14,565,922 | $560,228 | $63.64 | $251.25 | 217,038 | 270,173 | 26 | 206 | 79.09% |
| 2005 | $15,720,128 | $604,620 | $68.73 | $301.25 | 221,974 | 263,021 | 26 | 205 | 83.43% |
| 2006 | $16,236,503 | $676,521 | $73.71 | $301.25 | 209,932 | 243,526 | 24 | 191 | 85.50% |
| 2007 | $18,282,468 | $731,299 | $76.97 | $351.50 | 226,567 | 248,682 | 25 | 199 | 89.28% |
| 2008 | $18,701,223 | $719,278 | $76.93 | $350.00 | 233,715 | 263,440 | 26 | 208 | 87.83% |
| 2009 | $19,688,134 | $937,530 | $90.32 | $350.00 | 211,695 | 222,632 | 21 | 168 | 94.72% |
| 2010 | $19,562,428 | $815,101 | $86.67 | $350.00 | 217,085 | 258,568 | 24 | 192 | 82.93% |
| 2011 | $20,564,180 | $856,841 | $90.09 | $477.00 | 218,158 | 254,325 | 24 | 185 | 86.65% |
| 2012 | $23,546,987 | $840,964 | $95.60 | $477.00 | 238,483 | 289,549 | 28 | 222 | 82.12% |
| 2013 | $23,335,896 | $972,329 | $101.32 | $477.00 | 218,351 | 245,471 | 24 | 192 | 88.95% |
| 2014 | $25,926,516 | $997,174 | $107.49 | $477.00 | 237,242 | 258,647 | 26 | 206 | 92.08% |
| 2015 | $26,416,632 | $1,016,024 | $102.88 | $475.00 | 244,693 | 274,850 | 26 | 209 | 88.72% |
| 2016 | $24,062,537 | $962,501 | $101.77 | $477.00 | 225,907 | 275,157 | 25 | 201 | 82.21% |
| 2017 | $31,424,603 | $1,013,697 | $109.06 | $849.00 | 266,389 | 297,283 | 31 | 242 | 88.76% |
| 2018 | $37,289,893 | $1,202,900 | $135.44 | $850.00 | 277,794 | 301,208 | 31 | 244 | 92.18% |
| 2019 | $33,808,016 | $1,165,794 | $122.25 | $849.00 | 270,326 | 291,664 | 29 | 229 | 92.87% |
| 2022 | $27,682,655 | $1,203,594 | $124.18 | $597.00 | 212,341 | 239,632 | 23 | 182 | 87.80% |
| 2023 | $30,058,627 | $1,156,101 | $124.99 | $549.00 | 230,393 | 252,000 | 26 | 206 | 91.13% |
| 2024 | $30,768,450 | $1,183,402 | $124.39 | $594.00 | 242,572 | 257,208 | 26 | 208 | 94.01% |
Note: All data presented for informational purposes only. BroadwayWorld.com makes no guarantees as to the accuracy of the data, or the matter in which it's presented. Source: The Broadway League..
Videos
 |
KING OF DIAMONDS starring Rob Garrett & the Pretty Amazing Band
OYO Hotel/Casino (9/8 - 12/31)
PHOTOS
| |

|
The Cher Show (Non-Equity)
Smith Center For Performing Arts (9/17 - 9/22) | |

|
Two Girls
Open-Door Playhouse (11/12 - 12/12) | |

|
A Hill of Beans
Open-Door Playhouse (11/26 - 12/26) | |

|
The Fish and the Worm
Open-Door Playhouse (11/28 - 12/28) | |

|
Wolf Play
Black Box Theatre at UNLV (3/28 - 4/6) | |

|
Some Like It Hot
Pioneer Center for the Performing Arts (2/4 - 2/9) | |

|
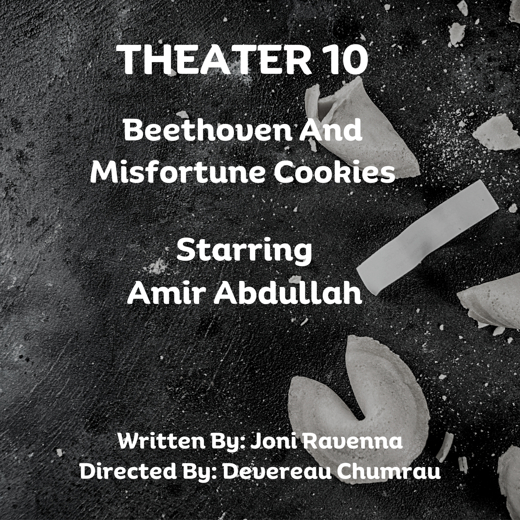
Beethoven And Misfortune Cookies
Open-Door Playhouse (3/11 - 3/11) | |
| VIEW SHOWS ADD A SHOW | ||
Recommended For You


