Stay Ahead of the Curtain Call!
Get the latest Broadway Grosses instantly, direct to your email every week.
Jump to Week: 1 | 2 | 3 | 4 | 5 | 6 | 7 | 8 | 9 | 10 | 11 | 12 | 13 | 14 | 15 | 16 | 17 | 18 | 19 | 20 | 21 | 22 | 23 | 24 | 25 | 26 | 27 | 28 | 29 | 30 | 31 | 32 | 33 | 34 | 35 | 36 | 37 | 38 | 39 | 40 | 41 | 42 | 43 | 44 | 45 | 46 | 47 | 48 | 49 | 50 | 51 | 52
| YEAR | Total Gross | Avg. Gross | Average Ticket | Top Ticket | Seats Sold |
Total Seats |
Shows | Perf. | Average % |
| 1996 | $5,051,852 | $336,790 | $41.12 | $75.00 | 116,684 | 40,496 | 15 | 112 | 37.45% |
| 1997 | $7,563,265 | $398,067 | $43.58 | $75.00 | 168,405 | 196,607 | 19 | 148 | 86.12% |
| 1998 | $9,635,755 | $356,880 | $42.55 | $80.00 | 215,835 | 274,261 | 27 | 215 | 77.71% |
| 1999 | $9,561,493 | $382,460 | $46.16 | $80.00 | 203,013 | 256,170 | 25 | 199 | 78.62% |
| 2000 | $8,895,191 | $386,747 | $51.93 | $90.00 | 169,159 | 234,812 | 23 | 182 | 72.16% |
| 2001 | $9,389,212 | $408,227 | $53.67 | $90.00 | 171,668 | 225,096 | 23 | 183 | 75.94% |
| 2002 | $9,103,189 | $455,159 | $56.37 | $480.00 | 150,839 | 192,364 | 20 | 153 | 78.56% |
| 2003 | $11,819,649 | $422,130 | $59.02 | $480.00 | 185,734 | 279,868 | 28 | 220 | 66.23% |
| 2004 | $11,691,291 | $433,011 | $61.35 | $480.00 | 177,064 | 277,119 | 27 | 212 | 63.21% |
| 2005 | $12,056,183 | $502,341 | $62.66 | $240.00 | 184,915 | 237,757 | 24 | 189 | 77.28% |
| 2006 | $14,846,427 | $571,016 | $71.72 | $301.25 | 199,902 | 254,488 | 26 | 208 | 79.02% |
| 2007 | $13,892,844 | $514,550 | $67.67 | $301.25 | 196,232 | 269,059 | 27 | 213 | 72.91% |
| 2008 | $13,260,883 | $442,029 | $67.18 | $351.50 | 186,597 | 290,091 | 30 | 239 | 63.39% |
| 2009 | $11,924,371 | $542,017 | $70.47 | $350.00 | 161,146 | 219,656 | 22 | 176 | 72.87% |
| 2010 | $13,619,685 | $619,077 | $79.00 | $350.00 | 166,708 | 219,376 | 22 | 176 | 77.38% |
| 2011 | $12,537,381 | $659,862 | $79.94 | $350.00 | 151,892 | 197,182 | 19 | 150 | 76.16% |
| 2012 | $17,414,095 | $669,773 | $80.57 | $477.00 | 205,816 | 258,696 | 26 | 208 | 79.98% |
| 2013 | $16,564,313 | $752,923 | $89.32 | $700.00 | 180,859 | 220,655 | 22 | 172 | 82.21% |
| 2014 | $16,714,699 | $642,873 | $86.03 | $477.00 | 183,092 | 233,934 | 26 | 206 | 77.81% |
| 2015 | $17,504,768 | $700,191 | $97.21 | $475.00 | 177,158 | 227,967 | 25 | 194 | 78.84% |
| 2016 | $23,617,253 | $787,242 | $92.39 | $477.00 | 247,475 | 298,403 | 30 | 239 | 83.19% |
| 2017 | $21,078,313 | $1,003,729 | $107.63 | $549.00 | 192,943 | 216,328 | 21 | 168 | 90.17% |
| 2018 | $24,869,635 | $956,524 | $121.43 | $850.00 | 210,097 | 239,982 | 26 | 203 | 87.69% |
| 2019 | $26,512,355 | $981,939 | $108.53 | $849.00 | 237,108 | 268,074 | 27 | 214 | 88.57% |
| 2020 | $26,036,075 | $1,041,443 | $111.91 | $847.00 | 232,823 | 249,476 | 25 | 196 | 92.98% |
| 2022 | $15,038,227 | $791,486 | $102.27 | $697.00 | 139,584 | 188,771 | 19 | 147 | 74.87% |
| 2023 | $25,705,039 | $1,117,610 | $119.96 | $549.00 | 206,578 | 219,064 | 23 | 184 | 94.04% |
| 2024 | $23,493,675 | $939,747 | $111.66 | $649.00 | 213,281 | 228,964 | 25 | 193 | 93.00% |
Note: All data presented for informational purposes only. BroadwayWorld.com makes no guarantees as to the accuracy of the data, or the matter in which it's presented. Source: The Broadway League..
Videos
 |
KING OF DIAMONDS starring Rob Garrett & the Pretty Amazing Band
OYO Hotel/Casino (9/8 - 12/31)
PHOTOS
| |

|
The Cher Show (Non-Equity)
Smith Center For Performing Arts (9/17 - 9/22) | |

|
Two Girls
Open-Door Playhouse (11/12 - 12/12) | |

|
A Hill of Beans
Open-Door Playhouse (11/26 - 12/26) | |

|
The Fish and the Worm
Open-Door Playhouse (11/28 - 12/28) | |

|
Wolf Play
Black Box Theatre at UNLV (3/28 - 4/6) | |
|
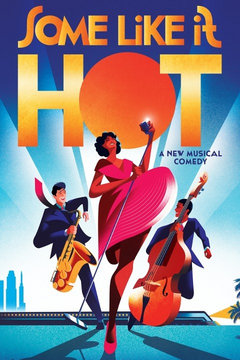
Some Like It Hot
Pioneer Center for the Performing Arts (2/4 - 2/9) | |

|
Beethoven And Misfortune Cookies
Open-Door Playhouse (3/11 - 3/11) | |
| VIEW SHOWS ADD A SHOW | ||
Recommended For You


