Stay Ahead of the Curtain Call!
Get the latest Broadway Grosses instantly, direct to your email every week.
Jump to Week: 1 | 2 | 3 | 4 | 5 | 6 | 7 | 8 | 9 | 10 | 11 | 12 | 13 | 14 | 15 | 16 | 17 | 18 | 19 | 20 | 21 | 22 | 23 | 24 | 25 | 26 | 27 | 28 | 29 | 30 | 31 | 32 | 33 | 34 | 35 | 36 | 37 | 38 | 39 | 40 | 41 | 42 | 43 | 44 | 45 | 46 | 47 | 48 | 49 | 50 | 51 | 52
| YEAR | Total Gross | Avg. Gross | Average Ticket | Top Ticket | Seats Sold |
Total Seats |
Shows | Perf. | Average % |
| 1996 | $9,589,152 | $383,566 | $44.31 | $75.00 | 203,684 | 249,005 | 25 | 194 | 80.42% |
| 1997 | $10,249,513 | $353,431 | $44.68 | $75.00 | 216,958 | 281,887 | 29 | 228 | 76.10% |
| 1998 | $11,397,854 | $356,183 | $46.30 | $75.00 | 234,875 | 319,398 | 32 | 253 | 72.96% |
| 1999 | $10,921,678 | $352,312 | $46.87 | $100.00 | 217,615 | 303,453 | 31 | 245 | 70.55% |
| 2000 | $13,242,697 | $401,294 | $53.16 | $90.00 | 242,144 | 333,275 | 33 | 261 | 72.25% |
| 2001 | $13,224,901 | $440,830 | $53.36 | $100.00 | 234,783 | 300,656 | 30 | 239 | 76.48% |
| 2002 | $13,903,579 | $463,453 | $57.94 | $480.00 | 226,249 | 287,195 | 30 | 232 | 78.41% |
| 2003 | $13,224,742 | $489,805 | $60.06 | $480.00 | 206,843 | 267,869 | 27 | 213 | 75.61% |
| 2004 | $14,276,098 | $492,279 | $60.53 | $480.00 | 222,253 | 282,832 | 29 | 223 | 75.93% |
| 2005 | $17,031,449 | $500,925 | $64.98 | $240.00 | 251,840 | 327,946 | 34 | 267 | 75.83% |
| 2006 | $18,407,301 | $575,228 | $70.61 | $301.25 | 248,614 | 311,328 | 32 | 256 | 79.69% |
| 2007 | $20,419,515 | $567,209 | $68.47 | $351.50 | 281,296 | 346,462 | 36 | 286 | 80.00% |
| 2008 | $18,239,680 | $536,461 | $69.47 | $351.50 | 249,266 | 327,608 | 34 | 272 | 74.80% |
| 2009 | $19,722,193 | $616,319 | $73.87 | $350.00 | 247,222 | 308,132 | 32 | 255 | 78.90% |
| 2010 | $20,741,224 | $628,522 | $80.44 | $350.00 | 243,014 | 325,984 | 33 | 264 | 73.18% |
| 2011 | $20,598,785 | $643,712 | $78.70 | $350.00 | 244,969 | 322,494 | 32 | 255 | 74.68% |
| 2012 | $24,157,235 | $671,034 | $87.98 | $477.00 | 257,495 | 350,644 | 36 | 287 | 73.25% |
| 2013 | $23,361,634 | $898,524 | $102.85 | $477.00 | 219,708 | 257,331 | 26 | 205 | 85.31% |
| 2014 | $28,348,062 | $787,446 | $97.07 | $477.00 | 279,158 | 338,679 | 36 | 285 | 81.89% |
| 2015 | $27,734,704 | $840,446 | $99.84 | $497.00 | 268,815 | 316,618 | 33 | 261 | 85.17% |
| 2016 | $27,019,166 | $750,532 | $93.31 | $477.00 | 274,699 | 347,457 | 36 | 287 | 79.32% |
| 2017 | $32,793,987 | $964,529 | $108.57 | $849.00 | 284,771 | 333,347 | 34 | 270 | 85.21% |
| 2018 | $39,211,500 | $1,153,279 | $131.75 | $850.00 | 302,808 | 328,800 | 34 | 267 | 92.37% |
| 2019 | $35,439,599 | $957,827 | $109.64 | $849.00 | 306,861 | 347,537 | 37 | 295 | 87.78% |
| 2021 | $19,663,442 | $728,276 | $102.72 | $449.00 | 168,169 | 215,173 | 27 | 183 | 75.98% |
| 2022 | $29,555,352 | $953,398 | $118.17 | $597.00 | 230,894 | 286,107 | 31 | 247 | 79.40% |
| 2023 | $31,144,237 | $916,007 | $113.72 | $549.00 | 263,096 | 314,260 | 34 | 269 | 82.94% |
| 2024 | $36,011,651 | $1,028,904 | $120.04 | $699.00 | 291,082 | 327,341 | 35 | 276 | 88.61% |
Note: All data presented for informational purposes only. BroadwayWorld.com makes no guarantees as to the accuracy of the data, or the matter in which it's presented. Source: The Broadway League..
Videos
 |
KING OF DIAMONDS starring Rob Garrett & the Pretty Amazing Band
OYO Hotel/Casino (9/8 - 12/31)
PHOTOS
| |

|
Wolf Play
Black Box Theatre at UNLV (3/28 - 4/6) | |

|
The Merry Wives of Windsor
Black Box Theatre at UNLV (12/5 - 12/15) | |

|
Miss Behave's Mavericks
The Plaza Hotel & Casino Showroom (10/2 - 10/2) | |

|
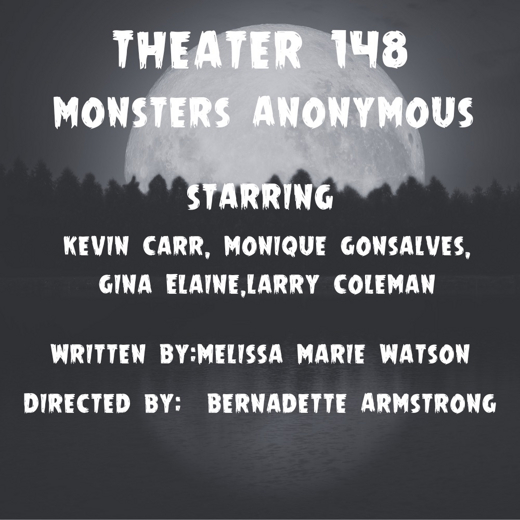
Monsters Anonymous
Open-Door Playhouse (10/23 - 11/23) | |

|
Will’s Dramaturg
Open-Door Playhouse (3/11 - 3/11) | |

|
Two Girls
Open-Door Playhouse (11/12 - 12/12) | |

|
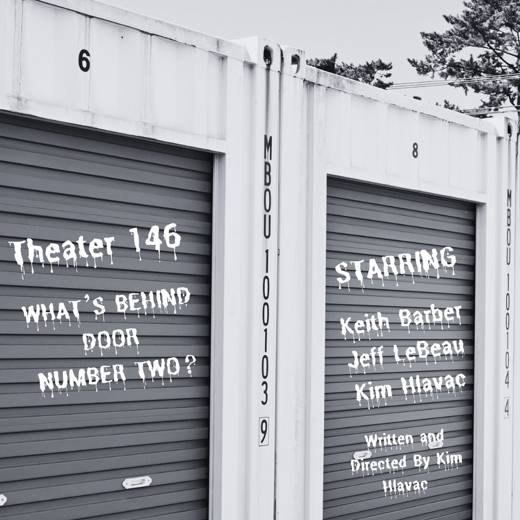
What's Behind Door Number Two?
Open-Door Playhouse (10/9 - 11/9) | |
| VIEW SHOWS ADD A SHOW | ||
Recommended For You


