Stay Ahead of the Curtain Call!
Get the latest Broadway Grosses instantly, direct to your email every week.
Jump to Week: 1 | 2 | 3 | 4 | 5 | 6 | 7 | 8 | 9 | 10 | 11 | 12 | 13 | 14 | 15 | 16 | 17 | 18 | 19 | 20 | 21 | 22 | 23 | 24 | 25 | 26 | 27 | 28 | 29 | 30 | 31 | 32 | 33 | 34 | 35 | 36 | 37 | 38 | 39 | 40 | 41 | 42 | 43 | 44 | 45 | 46 | 47 | 48 | 49 | 50 | 51 | 52
Total Seats
| YEAR | Total Gross | Avg. Gross | Average Ticket | Top Ticket | Seats Sold |
Total Seats |
Shows | Perf. | Average % |
| 1996 | $10,092,350 | $388,167 | $43.74 | $75.00 | 216,937 | 113,932 | 26 | 203 | 36.32% |
| 1997 | $11,214,966 | $361,773 | $44.69 | $75.00 | 239,033 | 299,547 | 31 | 241 | 78.19% |
| 1998 | $12,471,275 | $389,727 | $46.52 | $75.00 | 255,347 | 324,094 | 32 | 253 | 78.09% |
| 1999 | $12,755,947 | $386,544 | $47.83 | $100.00 | 253,369 | 324,995 | 33 | 263 | 77.45% |
| 2000 | $14,896,489 | $438,132 | $53.51 | $90.00 | 271,768 | 341,432 | 34 | 269 | 78.93% |
| 2001 | $14,015,082 | $467,169 | $54.14 | $100.00 | 249,777 | 300,656 | 30 | 239 | 81.33% |
| 2002 | $14,917,037 | $466,157 | $57.55 | $480.00 | 244,681 | 304,192 | 32 | 246 | 79.85% |
| 2003 | $14,545,859 | $501,581 | $58.52 | $480.00 | 231,169 | 275,269 | 29 | 223 | 82.29% |
| 2004 | $16,057,727 | $517,991 | $60.55 | $480.00 | 251,089 | 306,248 | 31 | 241 | 78.52% |
| 2005 | $18,748,812 | $535,680 | $65.43 | $240.00 | 273,074 | 338,600 | 35 | 273 | 79.76% |
| 2006 | $20,610,334 | $572,509 | $69.32 | $301.25 | 283,333 | 349,576 | 36 | 288 | 80.51% |
| 2007 | $20,922,895 | $581,192 | $68.86 | $351.50 | 288,242 | 350,788 | 36 | 284 | 80.99% |
| 2008 | $20,770,363 | $593,439 | $71.20 | $351.50 | 280,832 | 333,978 | 35 | 279 | 83.18% |
| 2009 | $20,413,145 | $600,387 | $70.78 | $350.00 | 271,392 | 325,459 | 34 | 269 | 80.49% |
| 2010 | $22,897,588 | $693,866 | $80.80 | $350.00 | 269,351 | 325,984 | 33 | 264 | 81.28% |
| 2011 | $24,911,286 | $711,751 | $82.32 | $350.00 | 288,757 | 338,162 | 35 | 276 | 84.18% |
| 2012 | $27,373,830 | $739,833 | $87.84 | $477.00 | 294,559 | 357,600 | 37 | 291 | 82.17% |
| 2013 | $25,537,731 | $945,842 | $103.02 | $477.00 | 240,878 | 263,251 | 27 | 213 | 90.87% |
| 2014 | $30,931,231 | $883,749 | $100.55 | $477.00 | 299,090 | 331,063 | 35 | 278 | 89.90% |
| 2015 | $29,304,273 | $888,008 | $100.18 | $497.00 | 285,566 | 318,292 | 33 | 262 | 89.43% |
| 2016 | $28,842,989 | $801,194 | $93.72 | $477.00 | 296,350 | 345,788 | 36 | 284 | 85.84% |
| 2017 | $34,503,598 | $958,433 | $107.52 | $849.00 | 303,288 | 343,580 | 36 | 281 | 88.39% |
| 2018 | $39,431,767 | $1,126,622 | $129.35 | $850.00 | 308,320 | 336,800 | 35 | 275 | 91.65% |
| 2019 | $35,905,670 | $970,424 | $109.24 | $849.00 | 314,317 | 347,065 | 37 | 295 | 90.38% |
| 2021 | $20,778,582 | $903,417 | $110.29 | $449.00 | 164,480 | 182,680 | 23 | 154 | 86.32% |
| 2022 | $33,290,185 | $951,148 | $119.76 | $597.00 | 257,558 | 315,597 | 35 | 277 | 80.31% |
| 2023 | $32,919,242 | $968,213 | $115.08 | $549.00 | 276,777 | 312,820 | 34 | 268 | 88.12% |
| 2024 | $35,295,405 | $1,038,100 | $119.35 | $649.00 | 287,246 | 314,225 | 34 | 268 | 91.14% |
Note: All data presented for informational purposes only. BroadwayWorld.com makes no guarantees as to the accuracy of the data, or the matter in which it's presented. Source: The Broadway League..
Videos
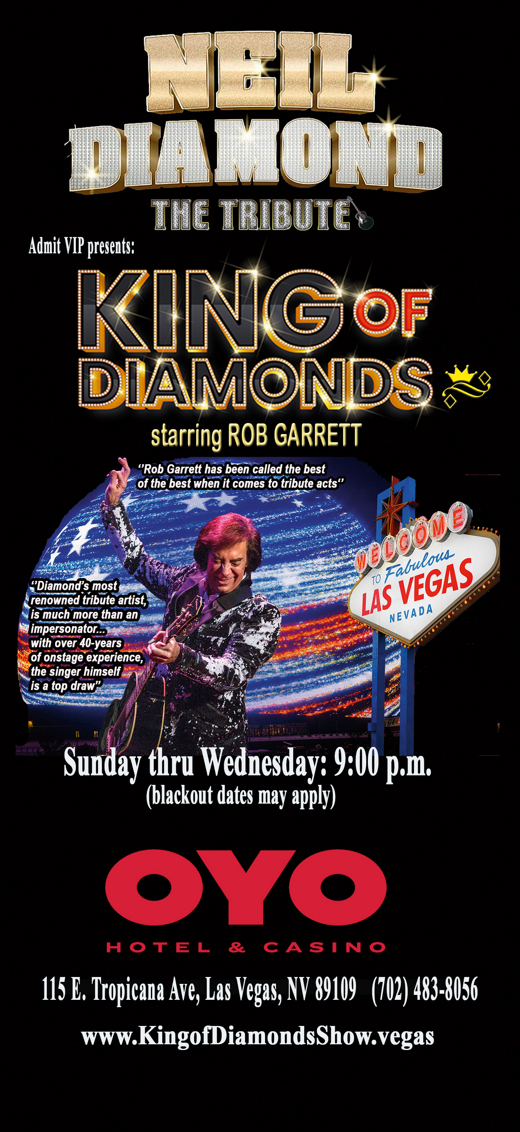 |
KING OF DIAMONDS starring Rob Garrett & the Pretty Amazing Band
OYO Hotel/Casino (9/8 - 12/31)
PHOTOS
| |

|
Anti-Soulmate
Open-Door Playhouse (3/11 - 3/11) | |
|
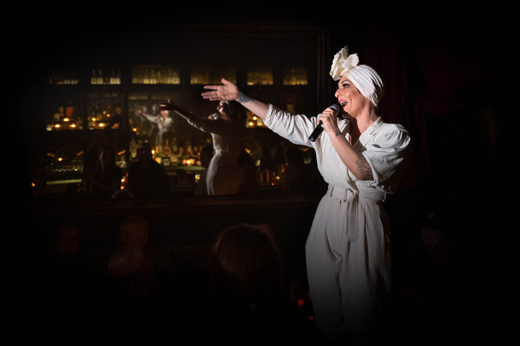
Miss Behave's Mavericks
The Plaza Hotel & Casino Showroom (10/2 - 10/2) | |
|
Hamilton (Philip Company)
Smith Center For Performing Arts (5/20 - 6/1) | |

|
The Golden Fleece
Open-Door Playhouse (3/11 - 3/11) | |
|
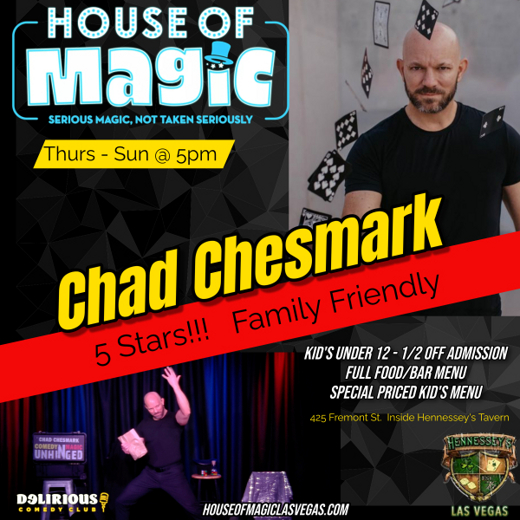
House of Magic - Family Friendly Comedy & Magic Show
Delirious Showroom At Hennessy's Tavern (6/13 - 12/29)
PHOTOS
| |

|
Kimberly Akimbo
Smith Center For Performing Arts (2/4 - 2/9) | |

|
& Juliet
Smith Center For Performing Arts (6/24 - 6/29) | |
| VIEW SHOWS ADD A SHOW | ||
Recommended For You


