Stay Ahead of the Curtain Call!
Get the latest Broadway Grosses instantly, direct to your email every week.
Jump to Week: 1 | 2 | 3 | 4 | 5 | 6 | 7 | 8 | 9 | 10 | 11 | 12 | 13 | 14 | 15 | 16 | 17 | 18 | 19 | 20 | 21 | 22 | 23 | 24 | 25 | 26 | 27 | 28 | 29 | 30 | 31 | 32 | 33 | 34 | 35 | 36 | 37 | 38 | 39 | 40 | 41 | 42 | 43 | 44 | 45 | 46 | 47 | 48 | 49 | 50 | 51 | 52
Attendance Percentage - This Week
| YEAR | Total Gross | Avg. Gross | Average Ticket | Top Ticket | Seats Sold |
Total Seats |
Shows | Perf. | Average % |
| 1996 | $8,781,724 | $399,169 | $44.44 | $75.00 | 186,123 | 206,487 | 22 | 166 | 90.47% |
| 1997 | $10,099,349 | $420,806 | $47.98 | $75.00 | 207,486 | 243,197 | 24 | 190 | 85.69% |
| 1998 | $10,249,007 | $445,609 | $50.07 | $75.00 | 199,275 | 234,669 | 23 | 183 | 83.77% |
| 1999 | $9,562,535 | $434,661 | $49.72 | $90.00 | 182,858 | 224,688 | 22 | 176 | 79.38% |
| 2000 | $11,541,570 | $461,663 | $54.14 | $90.00 | 206,407 | 255,417 | 25 | 190 | 81.04% |
| 2001 | $11,443,530 | $440,136 | $52.22 | $100.00 | 210,234 | 247,831 | 26 | 199 | 85.27% |
| 2002 | $14,943,531 | $515,294 | $59.95 | $480.00 | 236,359 | 283,484 | 29 | 228 | 82.04% |
| 2003 | $14,135,554 | $565,422 | $64.30 | $480.00 | 212,422 | 246,449 | 25 | 192 | 83.52% |
| 2004 | $12,179,708 | $507,488 | $60.56 | $251.25 | 188,265 | 234,294 | 24 | 180 | 77.49% |
| 2005 | $14,767,991 | $590,720 | $67.42 | $301.25 | 209,354 | 251,704 | 25 | 200 | 81.38% |
| 2006 | $16,473,676 | $633,603 | $73.84 | $301.25 | 211,902 | 244,481 | 26 | 200 | 84.80% |
| 2007 | $17,382,119 | $620,790 | $73.07 | $351.50 | 226,011 | 265,465 | 28 | 215 | 83.68% |
| 2008 | $17,964,427 | $619,463 | $76.21 | $350.00 | 226,844 | 283,777 | 29 | 227 | 78.94% |
| 2009 | $21,117,858 | $728,202 | $81.27 | $375.00 | 246,045 | 283,547 | 29 | 231 | 86.50% |
| 2010 | $19,676,095 | $634,713 | $76.75 | $350.00 | 241,385 | 301,640 | 31 | 248 | 79.30% |
| 2011 | $21,328,673 | $820,334 | $88.79 | $475.00 | 229,906 | 260,034 | 26 | 201 | 88.92% |
| 2012 | $20,614,959 | $792,883 | $90.38 | $477.00 | 214,024 | 246,570 | 26 | 197 | 86.87% |
| 2013 | $24,038,298 | $858,511 | $97.34 | $477.00 | 233,682 | 260,684 | 28 | 217 | 90.36% |
| 2014 | $25,993,467 | $838,499 | $98.61 | $477.00 | 256,002 | 297,738 | 31 | 246 | 85.84% |
| 2015 | $25,252,463 | $814,596 | $95.72 | $477.00 | 249,690 | 290,542 | 31 | 244 | 85.19% |
| 2016 | $25,369,050 | $874,795 | $100.25 | $549.00 | 243,037 | 281,362 | 29 | 225 | 87.33% |
| 2017 | $29,928,496 | $1,068,875 | $122.67 | $850.00 | 241,568 | 266,062 | 28 | 219 | 90.93% |
| 2018 | $34,344,693 | $1,040,748 | $124.85 | $850.00 | 269,065 | 299,926 | 33 | 258 | 89.17% |
| 2019 | $34,644,583 | $1,018,958 | $115.02 | $847.00 | 286,802 | 312,031 | 34 | 265 | 90.81% |
| 2022 | $28,621,480 | $1,060,055 | $117.62 | $599.00 | 225,731 | 248,460 | 27 | 208 | 89.26% |
| 2023 | $27,400,791 | $1,014,844 | $121.66 | $499.00 | 217,118 | 242,688 | 27 | 207 | 87.76% |
| 2024 | $34,689,137 | $991,118 | $119.55 | $594.00 | 282,356 | 311,176 | 35 | 267 | 90.23% |
Note: All data presented for informational purposes only. BroadwayWorld.com makes no guarantees as to the accuracy of the data, or the matter in which it's presented. Source: The Broadway League..
Videos
 |
KING OF DIAMONDS starring Rob Garrett & the Pretty Amazing Band
OYO Hotel/Casino (9/8 - 12/31)
PHOTOS
| |

|
The Merry Wives of Windsor
Black Box Theatre at UNLV (12/5 - 12/15) | |

|
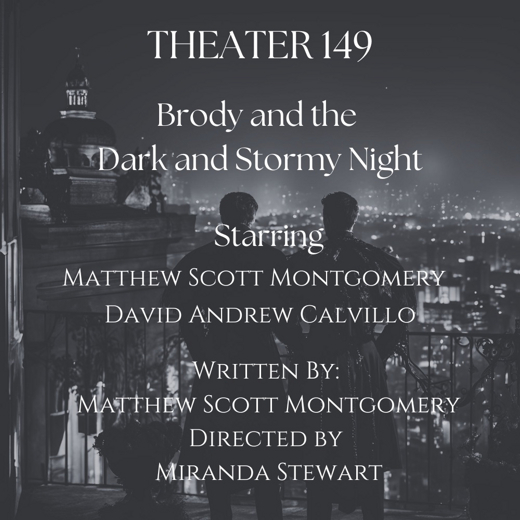
Brody and the Dark and Stormy Night
Open-Door Playhouse (10/31 - 12/1) | |

|
Theatre Shorts: Climate Plays
Paul Harris Theatre at UNLV (2/28 - 3/9) | |

|
Shrek the Musical (Non-Equity)
Smith Center For Performing Arts (11/26 - 12/1) | |

|
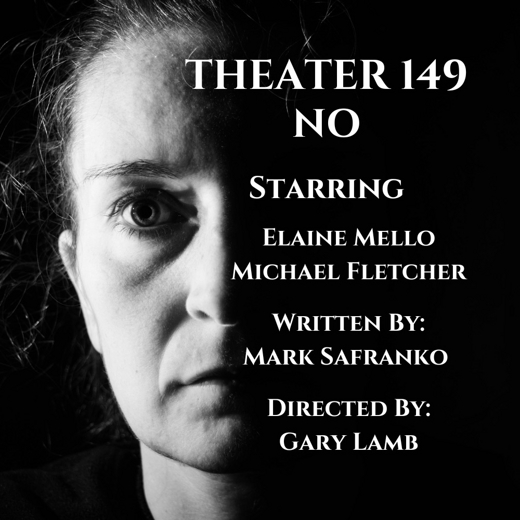
No....?
Open-Door Playhouse (11/20 - 12/20) | |

|
Wolf Play
Black Box Theatre at UNLV (3/28 - 4/6) | |

|
A Beautiful Noise
Pioneer Center for the Performing Arts (7/1 - 7/6) | |
| VIEW SHOWS ADD A SHOW | ||
Recommended For You


