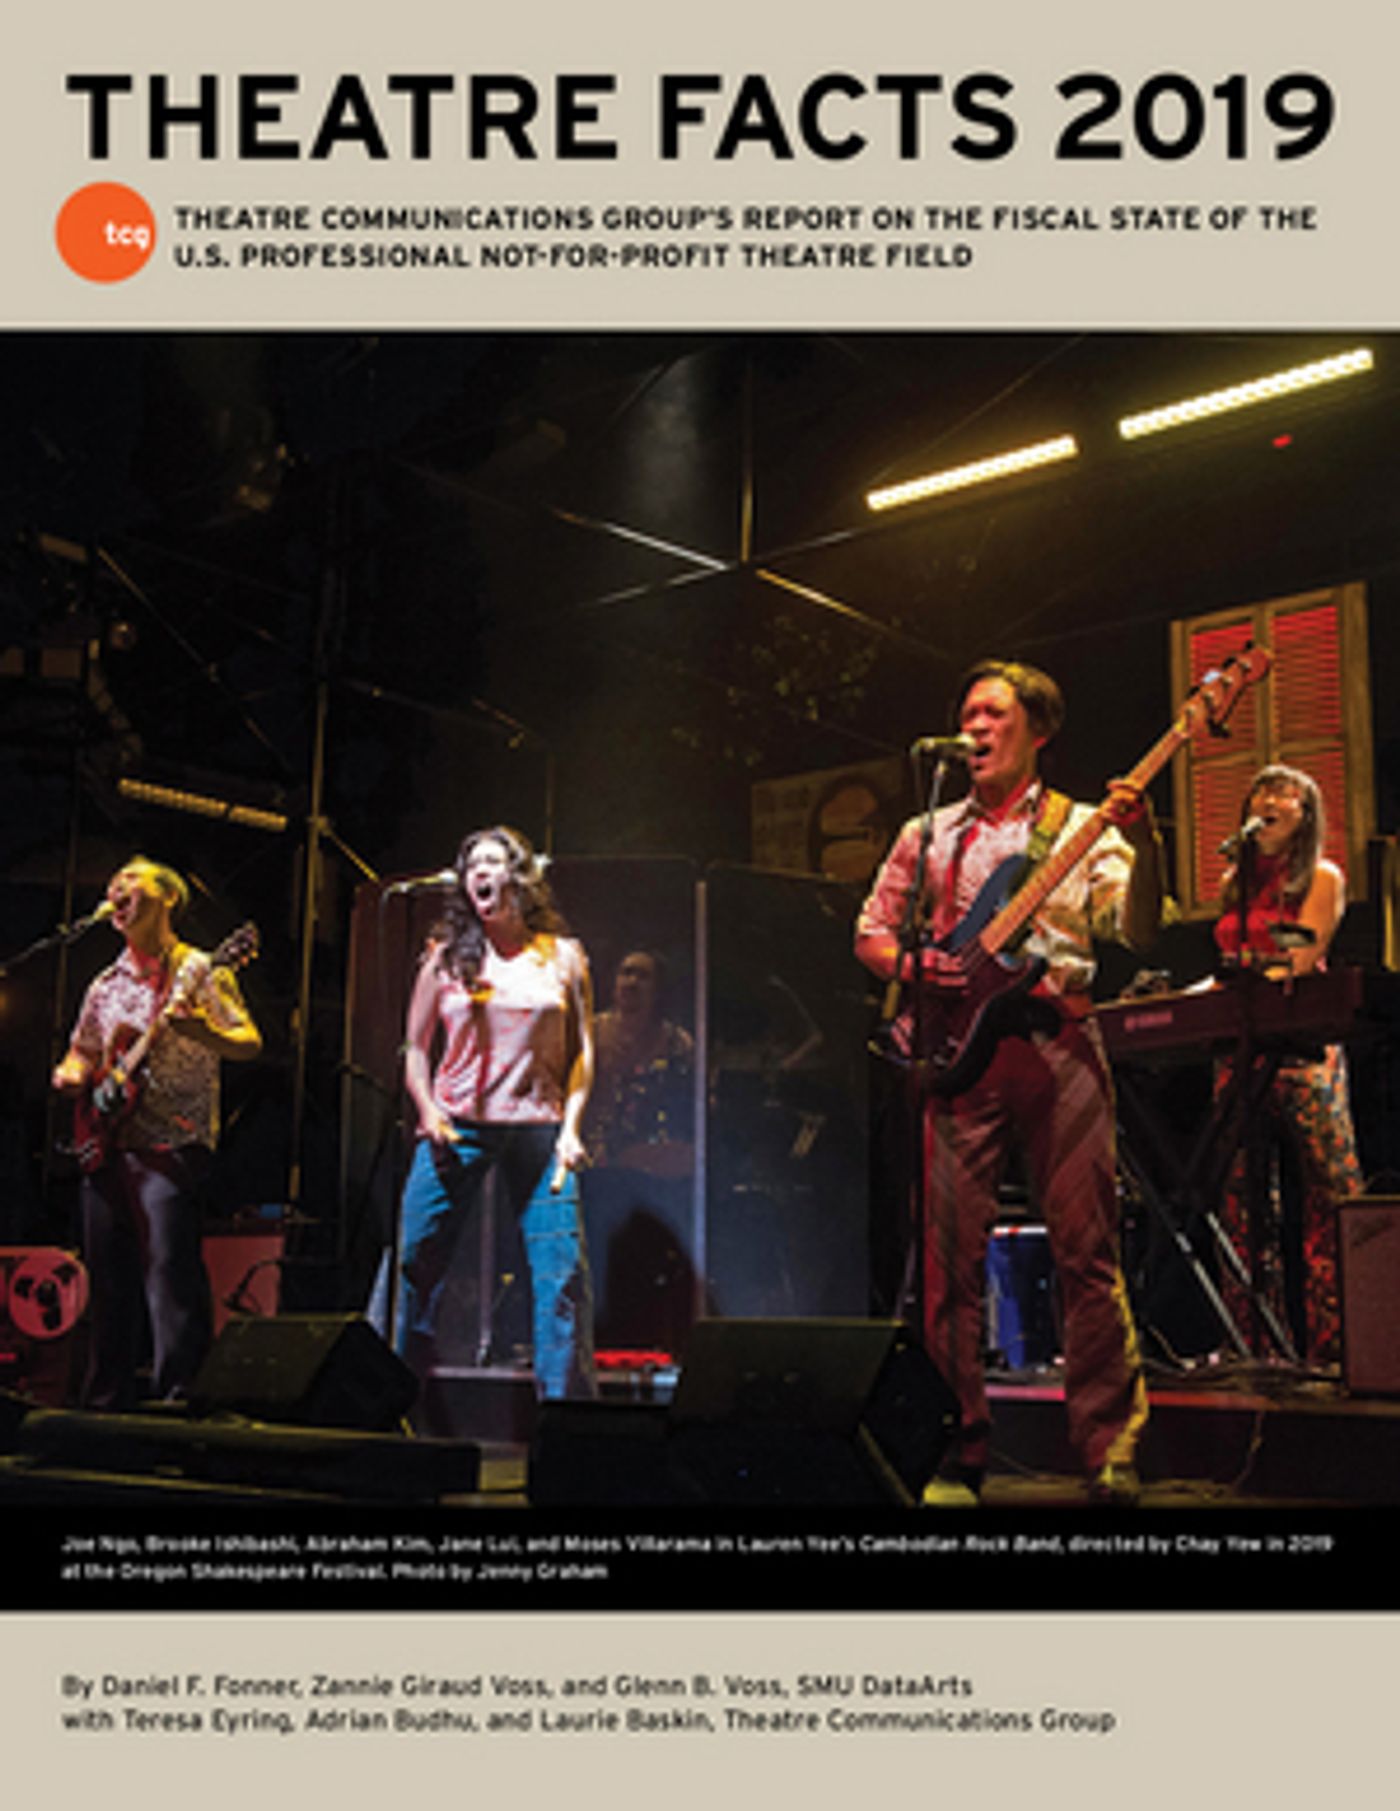
Theatre Communications Group Publishes Theatre Facts 2019, Examining the Fiscal State of Non-Profit Theatres For the Year
The report shows that the 84 Trend Theatres' finances were generally stable between 2015 and 2019.

Theatre Communications Group (TCG) has published its 2019 edition of Theatre Facts, which examines the attendance, performance, and overall fiscal state of the U.S. professional not-for-profit theatre field. The report shows that the 84 Trend Theatres' finances were generally stable between 2015 and 2019.
Earned income grew at a faster rate than expenses. The average single ticket income was 13.6% higher in 2019 than in 2015, and subscription income increased by 5.2% over the period.
The Change in Unrestricted Net Assets (CUNA), which represents theatres' annual bottom line, was at a five-year low, representing only 4.6 percent of total expenses in 2019.
Based on data from the annual TCG Fiscal Survey, and available to both TCG Member Theatres and the general public, Theatre Facts is a vital resource for theatre professionals, trustees, funders, policy makers, researchers, educators, students, and journalists.
Theatre Facts 2019 represents the 40th and final edition of this research report. Going forward, TCG will work with partners like SMUDataArts to reassess what research efforts are most needed as the theatre field recovers and returns from the COVID-19 pandemic.
Based on TCG Fiscal Survey 2019, which captured data from the fiscal year that theatres completed anytime between October 31, 2018 and September 30, 2019, Theatre Facts 2019 provides three lenses through which to view the not-for-profit theatre field's attendance, performance, and fiscal health: the Universe: a broad overview of the estimated 1,953 U.S. professional not-for-profit theatres; Trend Theatres: a longitudinal analysis of the 84 theatres that completed the TCG Fiscal Survey each year from 2015 through 2019; and Profiled Theatres: a detailed examination of all 129 theatres that participated in TCG Fiscal Survey 2019, with data broken out into six budget categories based on annual expenses.
Download the full report here.
Videos

